2024 marks the halfway point of the West Oakland Community Action Plan (WOCAP). There has been a significant and measurable reduction in air pollution in West Oakland over the course of WOCAP’s first five years, according to the WOCAP 5-Year Progress Report released by the plan’s oversight team. WOEIP and our partners are excited to build on this success as we continue working toward the plan’s 2030 goals. Highlights include:
Targeting for equity
The 80+ strategies in the West Oakland Community Action Plan were developed based on data that revealed seven impact zones—geographic areas within West Oakland that experience significantly more air pollution and higher health risks.
At its core, WOCAP has two simple target goals:
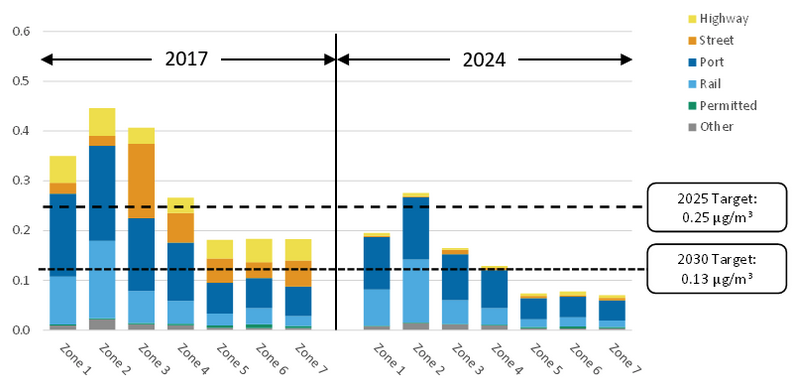
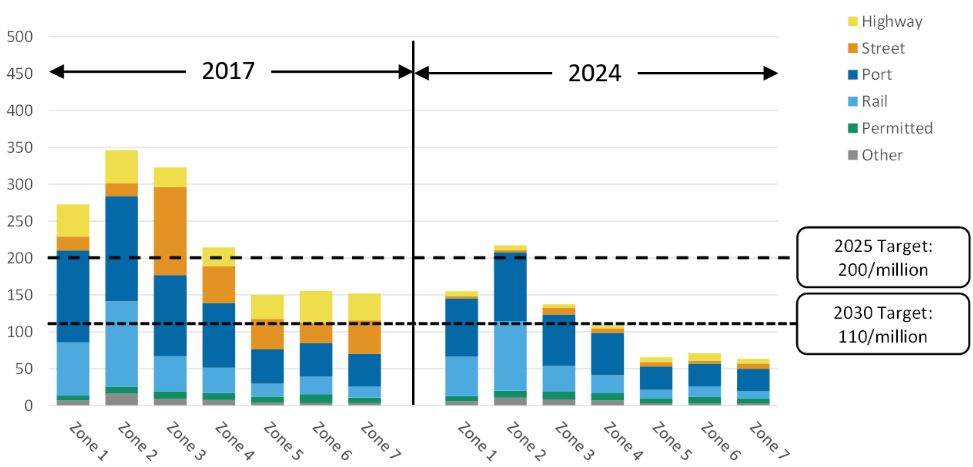
- By 2025, all seven impact zones should have the same (or better) air quality as West Oakland’s 2017 average.
- By 2030, all seven impact zones should have the same (or better) air quality as West Oakland’s “cleanest” neighborhood in 2017.
In other words, we want to eliminate the disparity in air pollution, so that no one population is bearing the burden of local pollution sources.
Diesel particulate matter is down in 6 of 7 West Oakland impact zones
In 2017, diesel particulate matter (DPM), produced by engine exhaust from trucks and other vehicles, represented the largest share of air pollution in West Oakland. The Air District’s latest emissions inventory reports that DPM in West Oakland is down 31% on average from its 2017 inventory. Even more promising, exposure to DPM is down by 56% overall. Exposure levels are influenced by things like weather, proximity to emissions sources, and other factors.

The largest DPM reduction was seen among highway and street vehicles. However, the Port of Oakland and rail-related sources are responsible for the majority of DPM in West Oakland. While the Air District measured some DPM reduction from these areas, the changes weren’t a significant contributor overall. And Impact Zone 2 still has higher-than-average DPM emissions. These issues will need to be addressed in the coming five years.
Cancer-risk weighted emissions are down in 6 of 7 West Oakland impact zones
Cancer risk is one key way of understanding the human impact of air pollution, and a key WOCAP metric tracks the increased risk of cancer from exposure to toxic air contaminants (known as TACs). As we saw with diesel particulate matter, the Air District’s inventory reports that cancer-risk weighted emissions have also gone down significantly (28%) since 2017. Cancer risk as a result of exposure to these emissions has gone down 54% across West Oakland as a whole.

It’s exciting to note that four West Oakland impact zones have already met or exceeded the 2030 WOCAP goal of the “cleanest” 2017 neighborhood when measuring cancer risk.
$51 million has been invested in emissions reduction projects
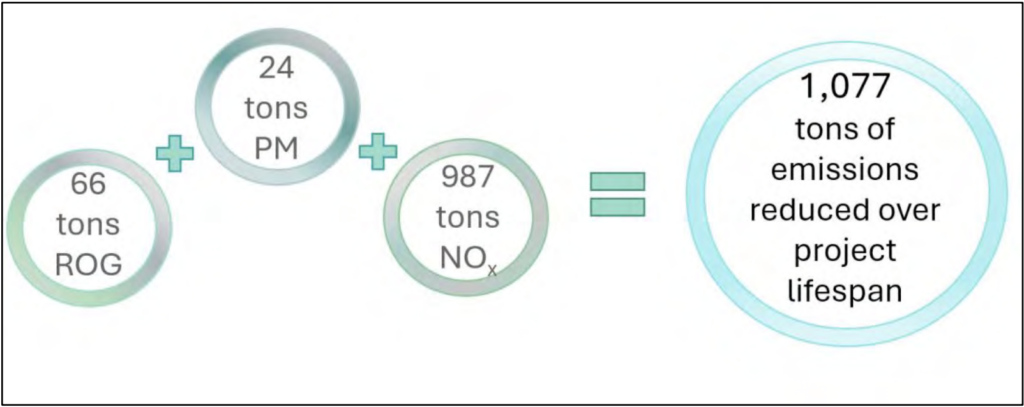
The 80+ West Oakland Community Action Plan strategies use a number of different approaches to tackle emissions and exposure. One of those approaches is through incentives—grants and credits that support important emissions-reduction upgrades and initiatives. Over the past five years, the Bay Area Air Quality Management District has invested $51 million dollars in 114 projects that go above and beyond existing requirements, to maximize reductions.

These projects typically involve the replacement and upgrade of old, dirty, heavily polluting mobile equipment and engines with cleaner options.
Looking forward to the work ahead
There’s been remarkable progress in reducing air pollution disparity across West Oakland neighborhoods, and reducing emissions and exposure overall. There is, of course, more to do for the West Oakland Community Action Plan to reach its full potential by 2030. These are a few of WOEIP’s priorities in the coming five years:
Bringing PM2.5 levels down
The Air District’s emissions inventory suggests that there’s still significant work to do to reduce particulate matter: 5 of the 7 impact zones still exceed WOCAP’s 2025 target. This appears to be in large part due to an increase in cars and road dust, which kick up fine particulates.
This is why WOEIP is currently researching the impact of street sweeping on controlling road dust including PM2.5, heavy metals, and other contaminants. Our WOAQ monitoring network is driving this cutting-edge research, and will be an influential tool in our application of resources and funding to reduce PM2.5 levels in the coming years.
Developing a more accurate understanding of health impacts
One major challenge facing researchers and the community is understanding the true impacts of air pollution exposure on human health. A number of reasons for this are discussed in more depth in the WOCAP 5-Year Progress Report (PDF), including the way data is collected, the amount of time it takes to see health changes surface, and impacts of the COVID pandemic. Understanding which health metrics to measure, how to measure them, and then actually collecting the data for analysis have all been limiting factors in the WOCAP Steering Committee’s ability to truly understand health impacts.
Once again, WOEIP is leading research in these areas. With funding from the US Environmental Protection Agency, WOEIP is spearheading a pair of projects that aim to identify and implement a clear methodology for measuring community health impacts that account for the existing challenges faced during WOCAP’s first five years. This foundational methodology can then be applied to our work going forward, and adapted by other communities working on similar issues.
Collaboration at the core of WOCAP’s success
The progress made in WOCAP’s first five years has been significant—and historic. We have seen measurable reductions in toxic air emissions and residential exposure to those emissions. This progress has been hard-earned, demanding much of the community, agency staff, research partners, and all the other collaborators who have contributed to this work. WOEIP is enthusiastic about our next five years, and the WOCAP’s impact on the West Oakland community. We hope to see you at the table with us in the weeks, months, and years to come.
Get involved
Interested in learning more about the West Oakland Community Action Plan? Join our mailing list, or contact owningourair@woeip.org.
Support our work
Help us continue improving air quality in West Oakland and beyond.